
Real-time radioactivity in Madrid

Real-time ionising radiation graphs are an outstanding tool for analysis of the data generated by the Geiger counter, with the measurements taken every minute.
All measurements are the CPM (clicks per minute) of a tube of detection of Beta and Gamma radiation STS-5 manufactured in Russia in the 1960s.
This tube detects about 25 pulses per minute in the normal background equivalent to about 0.1 uSv.
Please note: rapid increases in measurements is not a danger signThe fact that these events are not in themselves (especially when preceded by a period of no action), and should not be cause for alarm. Don't think we are under nuclear attack or anything like that. I explain why below.
Update: On 10 July 2023 I underwent medical treatment with radioactive iodine I-131 so during the following weeks there are high measurements corresponding to the times I spent near the meter.
Update: On 6 May 2025 I had a nuclear medicine test with an isotope so you will see high measurements, for a few days, corresponding to the times I spent near the meter.
This indirectly helped me to check that the meter was working properly, as it detected the radiation emitted by my body perfectly.
Right now
Last 24 hours
Last 7 days
Until 12 March 2022 there were some momentary very high peaks after a period of time without measures. This is not completely solved, although they should not occur so often anymore.
The peaks are due to the fact that a Geiger counter measures pulses and when the counter does not communicate those pulses for some reason, it counts them "all at once" (that is why those peaks are preceded by a period without measurements). I am working on solving this problem.
To give you an idea, the normal levels of this meter are between 20 and 60 cpm, under normal conditions.
Historical Beta and Gamma Radiation in Madrid
Below, you can see several graphs with the data collected by my Geiger counter in different periods.
This data is displayed from the website Radiation monitor (radmon.org) with the data sent by my station. You can download my raw measurement data, in SCV format, from there.
Radiation in Madrid in the last 24 hours
In this graph you can see the single measurements without any filtering or peak removal or smoothing.
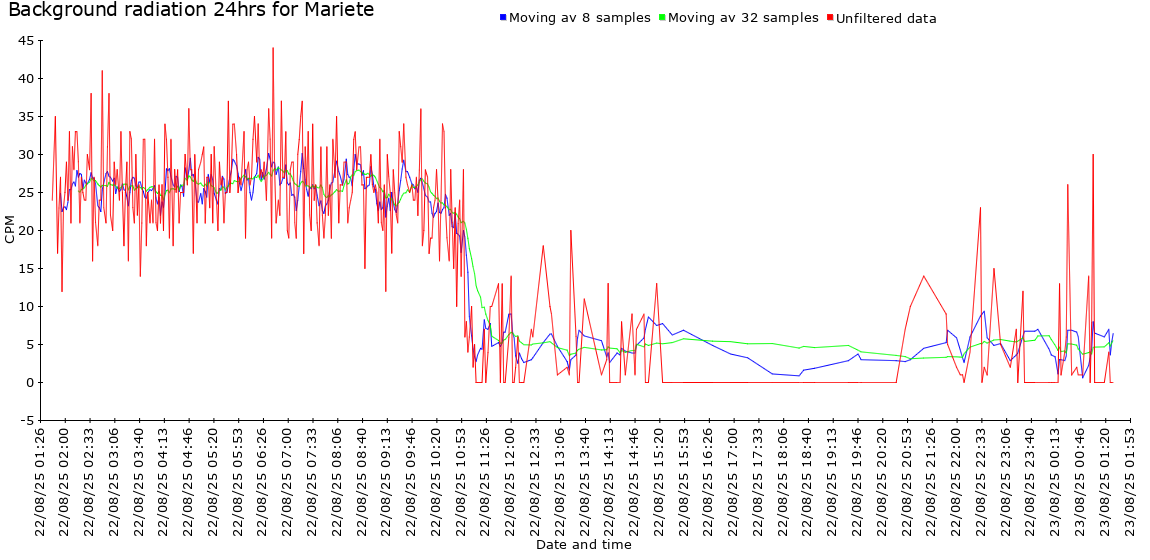
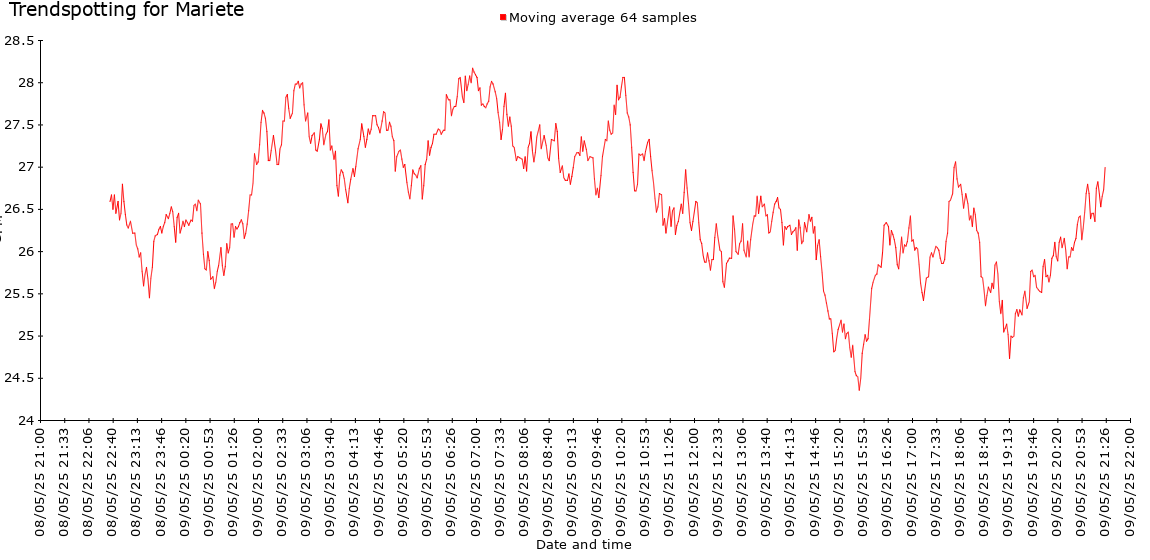
The following graph shows the measurements with a 64-sample moving average (re-averaging every 64 samples to smooth and remove peaks).
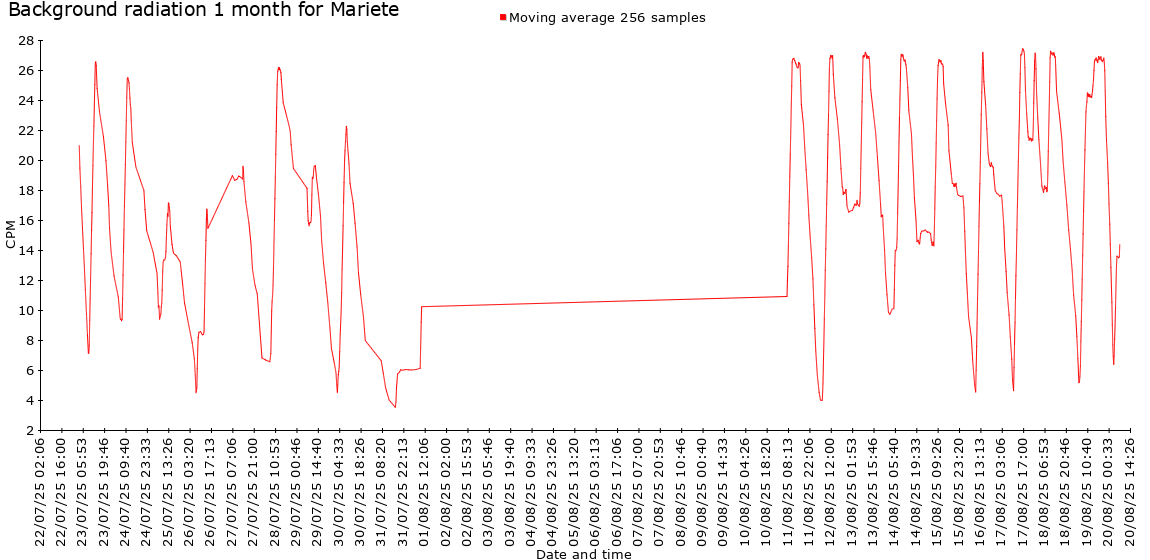
Radiation in Madrid in the last month
A 256-sample moving average is applied.
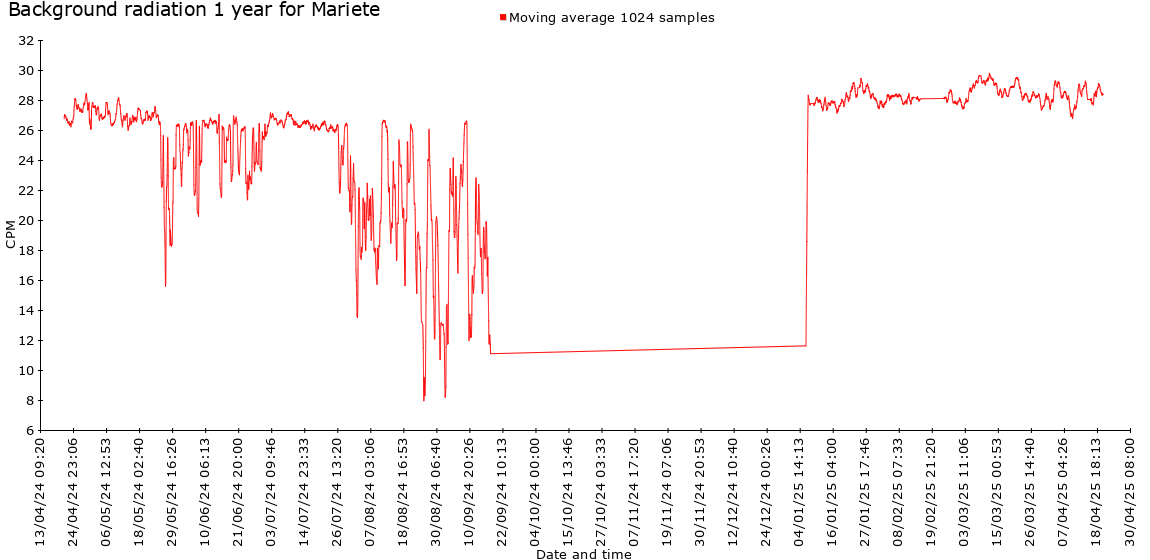
Radiation in Madrid in the last year
A moving average of 1024 samples is applied.
Why measure Beta and Gamma radiation?
There are few public sources of radiation data, so it seems interesting to have this information.
Given how dangerous it can be for health and the "health of the population".obscurantism"Can you trust official sources?
Recently (April 2020) a forest fire in Ukraine, in an area close to Chernobyl, has raised the alarm by a 16-fold increase in the usual radiation levels in the area, spreading a radioactive cloud over a large part of Europe (fortunately nothing serious).
In the following image you can see how the radiation even reached the east of Spain.

I am particularly reassured to see a graph like the one you can see below, with data on radioactivity in Madrid, collected by my own means on those dates, which I know have not been manipulated.
It shows how the radiation data during the fire, and in the following days, were at the same levels as in the days before the fire:
